Practical Tips to Improve Monthly Management Reports

“Welcome to Finance Transformation Times – One of the emerging newsletter followed by more than 11,000 Finance & Business Professionals globally for latest developments in Next Generation Finance.”
All too often, monthly reports are scribbled up, rushed out, and thrown immediately in the bin. If this sounds at all familiar, it’s worth thinking about ways in which you can write a report that not only gets read, but really adds value to a business.
This article looks at some things to keep in mind when planning and writing a monthly report.
First thing first, start with “Why”, what’s the purpose of monthly reports.
What are monthly reports for?
The purpose of monthly reports is to help management understand how the organisation is doing, and make decisions that will, hopefully, enhance business performance and drive improvement. They’re not for when things are going wrong and management are looking for someone to blame.
While some organisations don’t see much worth in the monthly report, a motivated accountant can transform the way they are viewed. Good monthly reports can even change an organisation’s culture – highlighting problems, but also celebrating successes.
With all this in mind, here are our ten practical tips for making monthly reports worth reading:
1. Clear Language

Improving business profits requires some basic fundamentals to be in place, before trickier issues are tackled, in terms of people, processes, objectives and strategy.
2. Keep Goals in Mind

All measures and data must be linked to a measurable performance indicator. So, every point that’s made should be referencing a specific KPI. Otherwise, we end up creating something that has no actionable benefit.
3. Think about the Big Picture

Thinking bigger, references to the organisation’s overall strategy, or its mission statement, can prick up some ears. Naturally, your organisation’s KPIs should be in service of this mission statement, but being able to demonstrate why they work – or why they don’t work – can really enhance a monthly report.
4. Encourage Improvement

The aim of management reports is to drive improvement, and there’s always room for improvement. This is their reason for being, so don’t forget it! Ensure that the points you are making are also forging a path forward, not simply bemoaning a specific performance or celebrating big wins.
5. Make it User-Friendly

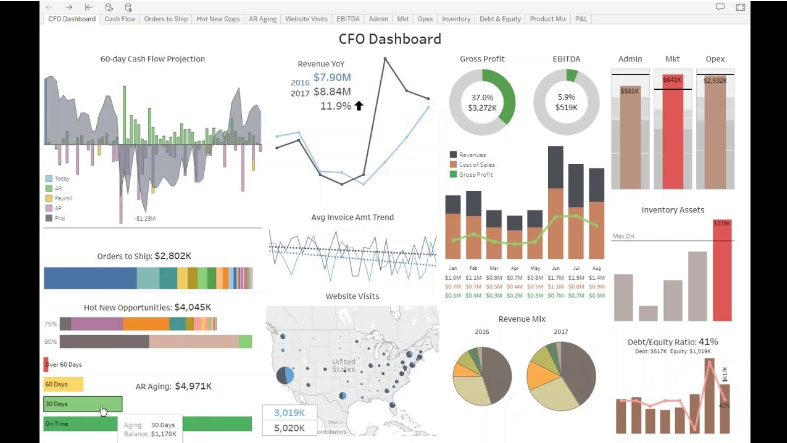
Information must be presented in a way that helps. Don’t jump to a graph when a sentence would do, and don’t shy away from making a graph if it illustrates something important. Management must be able to understand any data analysis presented, and draw clear and accurate conclusions from this.
6. Create Good Graphs

Information must be presented over time to show trends and anomalies. Single data points are useless! There’s no analysis to gleam from them, and certain figures in management might use them as an excuse to celebrate or punish – neither of which inspire real, sustained improvement.
Where possible, performance data collected over time should always be displayed in a run chart or a control chart. The Pareto chart can then be used to analyse particular aspects of the data. There are, of course, many other data analysis tools out there, but these three methods are very easy to use and provide a clear presentation of the data.
7. Keep Reports Future Oriented with Actionable Insights

Make sure not to just report the past numbers or business performance (what happened, where did it happen) but also include why did it happen, what’s going to happen and how can we make it happened. Here, need to leverage data analytics in order to generate some actional insights and foresights for businesses to take decisions.
8. Avoid Complex Statistics

Certain metrics that accountants are well-versed in can often sneak in to monthly reports, even though the audience for them might not fully grasp their importance. Even using simple ratios and percentages can conceal signals about what is going on in the real world. So, ratios, percentages and other forms of manipulation should be used only where you’re positive they’ll be understood.
9. Don't be a Know-it-all

Reports are only a guide to performance – they are not the full picture. The input and experience of the people working in the business will aid the understanding of performance issues. So, don’t be upset if management go off and find different conclusions – it’s nothing personal!
10. Make the Landing

It can be worth reiterating the crucial points for improvement that you’ve identified. The process of analysis and decision-making must be clearly laid out, understood and followed by all so that quality decisions are reached. Make sure management take home the message!
To sum it up…
Effective reporting involves an interconnected series of elements:
- A clear strategy with measurable strategic goals
- KPIs that link to, and measure, the organisation’s strategic goals
- A report that meets the needs of its audience
- Monthly reporting meetings where reports are analysed, problem areas identified, and potential solutions thought up
Reference: Accounting CPD Bite
If you are aspiring to transform and develop your Finance & Accounting careers to the next level of growth and to become a part of global finance community to build your global network, you can consider our upcoming training programs using the below link.

This into account only variable costs that rise or fall in line with the activity level. It can be used to inform short-term decision making in a way that absorption costing cannot.


